Week 10 play of the week

51.9UPS points · Bear Dunn
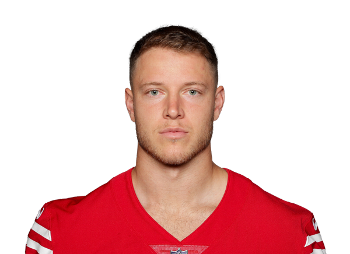
Christian McCaffrey
13 carries for 62 and 1 TD; 4 catches on 4 targets for 161 and 2 TD
Watch verified NFL highlights ↗At the desk: Stuart & Rich · Kenny Mayne in the Coffee Shop
Bear Dunn scored 308.9 in Week 10, the best score of the week, and beat all eleven teams in All-Play. Week 10 recap, built from the league’s own data; an editor has not reviewed it.
Bear Dunn scored 308.9 in Week 10, the best score of the week, and beat all eleven teams in All-Play. Bear Dunn swept all 3 games: Josh Martel by 173.9, Ryan Bousquet by 76.4, and Keith Creelman by 58.1. Bear Dunn is 24–3 overall and 99–11 in All-Play.
Bear Dunn scored 308.9 in Week 10: the 7th-highest single-week score and the 26th-best share of the league average among the 2,724 team-weeks since 2011 (playoffs and this season included).
Bear Dunn has beaten at least nine of the eleven other teams in each of the last 9 weeks. Only one regular-season team since 2011 has had a streak that long: Josh Martel in 2018 (10 weeks).
Ryan Bousquet put it in the chat Sunday at 2:31 PM: “I’m coming for you, mofos. I may even hit 210 this week! Check your rearview mirror, Bear.🤦♂️”, and then at 2:32 PM: “You would need a 22nd-century rearview”. Ryan Bousquet scored 232.5 that week and lost to Bear Dunn by 76.4.
Here is what 99–11 means. Since 2011, 180 teams have reached Week 10 with a full record in the league archive. Exactly one had a better All-Play record at this point: Josh Martel’s 2018 team, which was 103–7.
That is .900 for Bear Dunn. Josh Martel’s 2018 start was .936. After Bear Dunn, the next best starts are Derrick Whitman’s 2015 team at 85–25 and the 2013 team at 84–26, then Steve Bousquet’s 2017 team at 84–26.
And 2018 is the part worth sitting with. That team finished 25–1 with a 155–21 All-Play record, the best full season in the archive, and still lost the final. A great start is not a title.
Bear Dunn knows both ends of this. In 2021 the start was 28–82 in All-Play at this point. Now it is 99–11 with a 99.99% chance at the first-round bye and a 52.2% chance at the title in the forecast. The next best title odds belong to Eric Martel at 23.6%.
| Best All-Play starts through Week 10, 2011–2026 | Through Week 10 | Pct | How the season ended |
|---|---|---|---|
| 2018 · Josh Martel | 103–7 | .936 | Lost the final |
| 2026 · Bear Dunn | 99–11 | .900 | In progress |
| 2015 · Derrick Whitman | 85–25 | .773 | Third |
| 2013 · Derrick Whitman | 84–26 | .764 | Champion |
| 2017 · Steve Bousquet | 84–26 | .764 | Champion |
All-Play counts every team’s weekly score against all eleven others, Weeks 1–10 of the regular season. Source: the league archive of weekly results, 2011–2025, plus the 2026 standings. 2010 is left out because its archived weekly scores conflict with themselves. The finish is the archive’s final standing.
The other story of the week arrived Tuesday, and it was big: Eric Martel and Brian Cross made an eight-asset trade at 5:02 AM ET. Eric Martel sent Jordan Addison (WR), Brian Cross’s 2027 first-round pick, Brian Cross’s 2027 second-round pick, and Eric Martel’s 2027 fifth-round pick. Cross sent Trevor Lawrence (QB), Keith Creelman’s 2027 first-round pick, Derrick Whitman’s 2027 third-round pick, and $18,000 of blind-bid money.
The players Eric Martel sent carry $17,000 in salary, and the players Cross sent carry $37,000. Only 66 of the 1,036 trades in league history since 2010 moved eight assets or more.
Brian Cross made the case in the chat Tuesday at 6:50 AM: “Good Morning boys, sorry ! I have had so many T. Lawrence offers that I have refused . Yup , worst record in the league , ME . I did not see anything else coming over before the deadline on my tagged guy that I lose . I have put thought into my trades this year . I waited on the Henry deal with multiple offers to even get into the first round for 2027 . I could NOT let T. Law be lost with nothing and you know that . I felt I improved my draft capital as a need and yes swapping the firsts with a possibility that 1.04 out weighs 1.08 and in this draft and I feel the second helped way ahead of the third round pick . Yes , Addison is injured but could certainly have a game for himself in the toilet bowl with an improved QB . No player helps me now . I did not trade for Addison for now Blake . I am due some kind of luck so I went with something over nothing . I was not trying to give Hammer anything here or offend anyone . So many offers and I held out before it was a timing thing . I know you were in BBcutt and I was up front .” The player at the center of it was Trevor Lawrence: $37,000, 1 year left, and a starter in 9 of 10 weeks for Cross.
| Receives | Player or pick | Salary | Years left | Starts for the sender |
|---|---|---|---|---|
| Brian Cross | Jordan Addison (WR, MIN) | $17,000 | 1 | 0 of 10 |
| Brian Cross | Brian Cross’s 2027 first-round pick | — | — | — |
| Brian Cross | Brian Cross’s 2027 second-round pick | — | — | — |
| Brian Cross | Eric Martel’s 2027 fifth-round pick | — | — | — |
| Eric Martel | Trevor Lawrence (QB, JAC) | $37,000 | 1 | 9 of 10 |
| Eric Martel | Keith Creelman’s 2027 first-round pick | — | — | — |
| Eric Martel | Derrick Whitman’s 2027 third-round pick | — | — | — |
| Eric Martel | $18,000 of blind-bid money | — | — | — |
Source: MFL’s public transaction, roster and weekly-results exports; salary and years left are the players’ current MFL contracts; starts are weekly lineups through Week 10. The Playoff Picture below is the forecast on the post-trade rosters.
DOG POUND 4 LIFE v Maddie Mondays. Bear Dunn is the sweep, and you know that part. The pain is on the other side.
Keith Creelman scored 250.8 and went 2–1: beat Eric Mannila by 92.3, Chris Klingenberg by 76.3; lost to Bear Dunn by 58.1.
Ryan Bousquet scored 232.5 and went 2–1: beat Eric Mannila by 74.0, Chris Klingenberg by 58.0; lost to Bear Dunn by 76.4.
Chris Klingenberg scored 174.5 and went 1–2: beat Josh Martel by 39.5; lost to Keith Creelman by 76.3, Ryan Bousquet by 58.0. Chris Klingenberg is 15–12 overall but 1–5 against the division. Everything won has been won somewhere else.
Eric Mannila scored 158.5 and went 1–2: beat Josh Martel by 23.5; lost to Keith Creelman by 92.3, Ryan Bousquet by 74.0.
Josh Martel scored 135.0 and went 0–3: lost to Bear Dunn by 173.9, Chris Klingenberg by 39.5, Eric Mannila by 23.5. That was the lowest score of the week.
Keith Creelman and Chris Klingenberg are both 15–12, and the division is Creelman’s at 95.3% to Klingenberg’s <0.01%.
LEGION OF BOOM v Outlast PG Time. Shawn Blake scored 266.0 and went 3–0: beat Eric Martel by 72.7, Brian Cross by 61.4, Brian Cutting by 41.1.
Matt Gerardi scored 240.7, with 48.1 from Patrick Mahomes, and went 3–0: beat Eric Martel by 47.4, Brian Cross by 36.1, Brian Cutting by 15.8.
Brian Cutting scored 224.9 and went 1–2: beat Derrick Whitman by 43.8; lost to Shawn Blake by 41.1, Matt Gerardi by 15.8.
Brian Cross scored 204.6 and went 1–2: beat Derrick Whitman by 23.5; lost to Shawn Blake by 61.4, Matt Gerardi by 36.1.
Eric Martel scored 193.3 and went 1–2: beat Derrick Whitman by 12.2, the closest game of the week; lost to Shawn Blake by 72.7, Matt Gerardi by 47.4. That makes Eric Martel 6–0 against the division.
Derrick Whitman scored 181.1 and went 0–3: lost to Brian Cutting by 43.8, Brian Cross by 23.5, Eric Martel by 12.2.
Eric Martel is 20–7, and the forecast gives Eric Martel a better title chance, 23.6%, than Blake, 6.0%.
Which makes Brian Cross the story. Through Week 9, Cross was 22–77 in All-Play, tied for the fifth-worst start since 2011. Week 10 took Cross to 27–83, and 13 earlier teams were at that mark or worse by now, so the climb has left the all-time basement. It is still the worst start of that owner’s career in the archive, 9 games under the 36–74 in 2025.
| Division | Swept | Split | Shut out |
|---|---|---|---|
| DOG POUND 4 LIFE v Maddie Mondays | Bear Dunn 308.9 | Keith Creelman 250.8, Ryan Bousquet 232.5, Chris Klingenberg 174.5, Eric Mannila 158.5 | Josh Martel 135.0 |
| LEGION OF BOOM v Outlast PG Time | Shawn Blake 266.0, Matt Gerardi 240.7 | Brian Cutting 224.9, Brian Cross 204.6, Eric Martel 193.3 | Derrick Whitman 181.1 |
Week 10 scores. A team is Swept when it won every game it played in the group, Shut out when it won none and Split otherwise. History lines use the league archive of weekly results (2010 is left out because its archived scores conflict with themselves). Chat lines are owner posts in the league Discord, linked to the message.
Here is the shape of it. Four division leaders: Bear Dunn at 99.99% to win Dog Pound 4 Life, Eric Martel at 99.1%, Keith Creelman at 95.3%, and Shawn Blake at 93.8%.
Then the wild-card road. Brian Cutting is 99.6% with a 0.9% division chance, and Cutting is counting entirely on a wild card. Derrick Whitman is 54.2% to make the playoffs with only a 6.2% chance of winning the division, so Whitman gets in the other way. Chris Klingenberg is 36.4% and Mannila 8.8%.
And the bottom: Ryan Bousquet is at 5.3%, Matt Gerardi at <0.01%, Brian Cross at <0.01%, and Josh Martel at <0.01%.
| Franchise | Playoffs | First-round bye | Wins division | Title |
|---|---|---|---|---|
| Bear Dunn | 99.99% | 99.99% | 99.99% | 52.2% |
 Eric Martel | 99.99% | 97.5% | 99.1% | 23.6% |
 Brian Cutting | 99.6% | 0.7% | 0.9% | 13.4% |
 Shawn Blake | 99.3% | 1.8% | 93.8% | 6.0% |
 Keith Creelman | 96.4% | 0.04% | 95.3% | 3.7% |
 Derrick Whitman | 54.2% | <0.01% | 6.2% | 0.9% |
 Chris Klingenberg | 36.4% | <0.01% | <0.01% | 0.2% |
 Eric Mannila | 8.8% | <0.01% | <0.01% | 0.02% |
 Ryan Bousquet | 5.3% | <0.01% | 4.7% | 0.04% |
 Matt Gerardi | <0.01% | <0.01% | <0.01% | <0.01% |
 Brian Cross | <0.01% | <0.01% | <0.01% | <0.01% |
 Josh Martel | <0.01% | <0.01% | <0.01% | <0.01% |
Probabilities updated after Week 10 (Wed Nov 18, 11:32 AM ET), 10,000 simulated seasons. One team wins each division in every simulated season; division odds and the league’s title odds are rounded so each group still adds up to the whole. A probability prints as certain only when the outcome is clinched or eliminated; a figure that would round to certain prints to two decimals, or as <0.01%.
Start with the number nobody had. George Pickens was projected for 10.1 and scored 46.9 for Ryan Bousquet. That is +36.8, the biggest bargain of the week. Dallas Turner added 15.5 against a 6.0 projection.
Dak Prescott was projected for 17.1 and scored 49.2 for Keith Creelman, another big bargain. Patrick Mahomes, Matt Gerardi’s quarterback, was projected for 16.3 and put up 48.1. Joe Burrow, Bear Dunn’s quarterback, was projected for 15.9 and put up 47.5.
Now the other side. Bear Dunn started Brock Bowers and Chase Young, projected for 20.4 and 8.2, and got 5.2 and 1.5 from them. That is 21.9 projected points that never showed up, and Bear Dunn still scored 308.9 and went 3–0.
On defense, Maxx Crosby gave Brian Cross 20.5 on a 7.0 projection.
13 carries for 62 and 1 TD; 4 catches on 4 targets for 161 and 2 TD
Watch verified NFL highlights ↗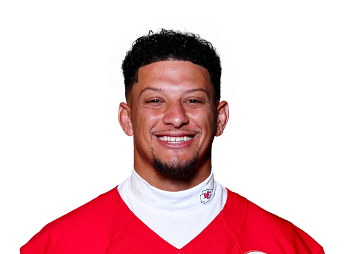
22-of-35 for 348, 5 TD; 2 carries for 15
Brock Bowers (TE, Bear Dunn)MFL proj. Sun 3:06 PM ET · kickoff Sun 4:05 PM ET20.4 → 5.2-15.2Drake Maye (QB, Brian Cutting)MFL proj. Fri 2:31 PM ET · kickoff Sun 9:30 AM ET16.9 → 3.4-13.5Kyren Williams (RB, Chris Klingenberg)MFL proj. Sun 3:06 PM ET · kickoff Sun 4:05 PM ET17.5 → 5.0-12.5Trey McBride (TE, Eric Martel)MFL proj. Sun 3:06 PM ET · kickoff Sun 4:05 PM ET23.8 → 11.6-12.2Christian Watson (WR, Eric Mannila)MFL proj. Sun 12:37 PM ET · kickoff Sun 1:00 PM ET17.1 → 7.1-10.0George Pickens (WR, Ryan Bousquet)MFL proj. Sun 3:06 PM ET · kickoff Sun 4:25 PM ET10.1 → 46.9+36.8Dak Prescott (QB, Keith Creelman)MFL proj. Sun 3:06 PM ET · kickoff Sun 4:25 PM ET17.1 → 49.2+32.1Patrick Mahomes (QB, Matt Gerardi)MFL proj. Sun 12:37 PM ET · kickoff Sun 1:00 PM ET16.3 → 48.1+31.8Joe Burrow (QB, Bear Dunn)MFL proj. Sun 3:06 PM ET · kickoff Sun 8:20 PM ET15.9 → 47.5+31.6Christian McCaffrey (RB, Bear Dunn)MFL proj. Sun 3:06 PM ET · kickoff Sun 4:25 PM ET21.7 → 51.9+30.2Quentin Lake (DB, Eric Martel)MFL proj. Sun 3:06 PM ET · kickoff Sun 4:05 PM ET11.5 → 2.1-9.4Minkah Fitzpatrick (DB, Ryan Bousquet)MFL proj. Sun 12:37 PM ET · kickoff Sun 1:00 PM ET9.5 → 2.1-7.4Nick Scott (DB, Josh Martel)MFL proj. Sun 12:37 PM ET · kickoff Sun 1:00 PM ET8.1 → 1.3-6.8Myles Garrett (DL, Brian Cutting)MFL proj. Sun 3:06 PM ET · kickoff Sun 4:05 PM ET6.7 → 0.0-6.7Chase Young (DL, Bear Dunn)MFL proj. Sun 12:37 PM ET · kickoff Sun 1:00 PM ET8.2 → 1.5-6.7Maxx Crosby (DL, Brian Cross)MFL proj. Sun 3:06 PM ET · kickoff Sun 4:05 PM ET7.0 → 20.5+13.5Cedric Gray (LB, Shawn Blake)MFL proj. Sun 12:37 PM ET · kickoff Sun 1:00 PM ET6.5 → 16.5+10.0Dallas Turner (DL, Ryan Bousquet)MFL proj. Sun 12:37 PM ET · kickoff Sun 1:00 PM ET6.0 → 15.5+9.5Andrew Van Ginkel (DL, Brian Cutting)MFL proj. Sun 12:37 PM ET · kickoff Sun 1:00 PM ET6.5 → 15.5+9.0Devon Witherspoon (DB, Brian Cross)MFL proj. Sun 3:06 PM ET · kickoff Sun 4:05 PM ET7.8 → 15.7+7.9Started players only. Projection source: each player’s last MFL projection saved before his own kickoff, captured Thu Nov 12, 7:53 PM ET, Fri Nov 13, 2:31 PM ET, Sun Nov 15, 12:37 PM ET and later; every row shows its capture time and the player’s own kickoff, and every capture came first. 192 offensive and defensive starters graded; 0 not graded for want of a pregame capture. Largest gaps among graded starters, not every starter.
Treat the last three weeks as their own season. In Weeks 8–10, Bear Dunn is 32–1 in All-Play. That is the only Dominant team in the league. The next best are Eric Martel at 25–8 and Shawn Blake at 21–12.
The movers. Ryan Bousquet climbed from tenth in scoring in Weeks 1–7 to sixth in Weeks 8–10. Keith Creelman climbed from sixth in scoring in Weeks 1–7 to third in Weeks 8–10. Derrick Whitman fell from fifth to tenth and is 8–25 over the stretch. Brian Cross went from ninth to twelfth.
Then ask what history says about where everyone sits after Week 10. The Survival Line looks at past seasons: of teams with Eric Martel’s All-Play rank at this point, 18 of 20 made the playoffs; Bear Dunn’s group, 18 of 20; Brian Cutting’s group, 17 of 18; Shawn Blake’s group, 17 of 18.
At the bottom, Brian Cross is 1 of 17 by All-Play rank and 0 of 8 by wins, and Josh Martel is 1 of 17 and 0 of 8. Both are at <0.01%. Matt Gerardi is 3 of 17 and 0 of 8, with odds of <0.01%.
And luck. Josh Martel is +1.8 wins over what the All-Play rate predicts, the most in the league, and Shawn Blake is −1.4, the fewest (Brian Cutting is level at that figure). Brian Cutting leaves 41.5 points on the bench every week, also the most, and 7 of 12 losses would have been wins with the best lineup.
| Franchise | Division | Record | Week 10 all-play | All-play | Points for |
|---|---|---|---|---|---|
| Bear Dunn | leader | 24–3 | 11–0 | 99–11 | 2,732.0 |
| Eric Martel | leader | 20–7 | 4–7 | 81–29 | 2,447.4 |
| Shawn Blake | leader | 16–11 | 10–1 | 69–41 | 2,289.8 |
| Brian Cutting | 15–12 | 6–5 | 66–44 | 2,253.8 | |
| Keith Creelman | leader | 15–12 | 9–2 | 59–51 | 2,209.2 |
| Chris Klingenberg | 15–12 | 2–9 | 57–53 | 2,026.3 | |
| Derrick Whitman | 13–14 | 3–8 | 57–53 | 2,097.4 | |
| Eric Mannila | 13–14 | 1–10 | 49–61 | 2,026.4 | |
| Ryan Bousquet | 11–16 | 7–4 | 40–70 | 1,955.0 | |
| Matt Gerardi | 7–20 | 8–3 | 32–78 | 1,859.7 | |
| Brian Cross | 6–21 | 5–6 | 27–83 | 1,856.2 | |
| Josh Martel | 7–20 | 0–11 | 24–86 | 1,780.7 |
In the same order as the league standings page: the current playoff field first (division leaders take the top two places), then everyone else; every place goes by all-play percentage, then overall record, then points for, then head-to-head.
| Week 10 matchup | Our favorite | Final | Called it? |
|---|---|---|---|
| Bear Dunn vs Josh Martel | Bear Dunn (97%) | 308.9–135.0 | yes |
| Bear Dunn vs Ryan Bousquet | Bear Dunn (86%) | 308.9–232.5 | yes |
| Chris Klingenberg vs Josh Martel | Chris Klingenberg (85%) | 174.5–135.0 | yes |
| Bear Dunn vs Keith Creelman | Bear Dunn (81%) | 308.9–250.8 | yes |
| Shawn Blake vs Brian Cross | Shawn Blake (80%) | 266.0–204.6 | yes |
| Eric Mannila vs Josh Martel | Eric Mannila (77%) | 158.5–135.0 | yes |
| Eric Martel vs Matt Gerardi | Eric Martel (75%) | 193.3–240.7 | no |
| Eric Martel vs Derrick Whitman | Eric Martel (74%) | 193.3–181.1 | yes |
| Brian Cutting vs Matt Gerardi | Brian Cutting (74%) | 224.9–240.7 | no |
| Brian Cutting vs Derrick Whitman | Brian Cutting (74%) | 224.9–181.1 | yes |
| Keith Creelman vs Eric Mannila | Keith Creelman (63%) | 250.8–158.5 | yes |
| Chris Klingenberg vs Ryan Bousquet | Chris Klingenberg (59%) | 174.5–232.5 | no |
| Derrick Whitman vs Brian Cross | Derrick Whitman (58%) | 181.1–204.6 | no |
| Matt Gerardi vs Brian Cross | Matt Gerardi (57%) | 240.7–204.6 | yes |
| Ryan Bousquet vs Eric Mannila | Ryan Bousquet (53%) | 232.5–158.5 | yes |
| Shawn Blake vs Brian Cutting | Shawn Blake (51%) | 266.0–224.9 | yes |
| Eric Martel vs Shawn Blake | Eric Martel (51%) | 193.3–266.0 | no |
| Keith Creelman vs Chris Klingenberg | Keith Creelman (51%) | 250.8–174.5 | yes |
Last week’s published preview, graded against the final scores: favorites won 13 of 18.
| Team Reading | All-Play Wks 8–10 (season) | Scoring rank Wks 1–7 → Wks 8–10 |
|---|---|---|
| Bear Dunn Dominant | 32–1 (99–11) | 1st → 1st |
| Eric Martel Holding | 25–8 (81–29) | 2nd → 2nd |
| Shawn Blake Holding | 21–12 (69–41) | 3rd → 4th |
| Keith Creelman Holding | 20–13 (59–51) | 6th → 3rd |
| Brian Cutting Holding | 18–15 (66–44) | 4th → 5th |
| Ryan Bousquet Rising | 16–17 (40–70) | 10th → 6th |
| Chris Klingenberg Holding | 15–18 (57–53) | 7th → 8th |
| Eric Mannila Holding | 15–18 (49–61) | 8th → 7th |
| Matt Gerardi Holding | 12–21 (32–78) | 11th → 9th |
| Josh Martel Holding | 10–23 (24–86) | 12th → 11th |
| Derrick Whitman Cooling | 8–25 (57–53) | 5th → 10th |
| Brian Cross Holding | 6–27 (27–83) | 9th → 12th |
Sorted by All-Play over Weeks 8–10; the full-season All-Play record is in parentheses. Reading, applied in order: Dominant = at least 28 of every 33 all-play games in that stretch; Sinking = 5 of every 33 or fewer; Rising / Cooling = scoring rank moved four or more places; otherwise Holding.
| Team | Left on bench / wk | Losses the best lineup would have won | Wins vs expected |
|---|---|---|---|
| Brian Cutting | 41.5 | 7 of 12 | −1.4 |
| Eric Martel | 30.1 | 3 of 7 | +0.5 |
| Chris Klingenberg | 28.5 | 2 of 12 | +0.9 |
| Matt Gerardi | 28.4 | 8 of 20 | −0.5 |
| Ryan Bousquet | 26.3 | 6 of 16 | +1.3 |
| Keith Creelman | 26.3 | 5 of 12 | −0.0 |
| Shawn Blake | 25.8 | 5 of 11 | −1.4 |
| Derrick Whitman | 24.8 | 5 of 14 | −1.3 |
| Eric Mannila | 23.8 | 6 of 14 | +1.7 |
| Josh Martel | 22.7 | 6 of 20 | +1.8 |
| Bear Dunn | 20.3 | 2 of 3 | −0.8 |
| Brian Cross | 18.5 | 4 of 21 | −0.9 |
Bench points = the best possible lineup from the same roster, known only after the games, minus the lineup started. Wins vs expected = head-to-head wins minus the wins each week’s all-play rate would give.
| Team | Category, playoffs | Made it from the same All-Play rank, 2017–2025 | Made it with the same win total, 2021–2025 |
|---|---|---|---|
| Eric Martel | Contender 99.99% | 18/20 | 10/11 |
| Bear Dunn | Contender 99.99% | 18/20 | 7/7 |
| Brian Cutting | Contender 99.6% | 17/18 | 10/18 |
| Shawn Blake | Contender 99.3% | 17/18 | 10/18 |
| Keith Creelman | Contender 96.4% | 12/16 | 10/18 |
| Derrick Whitman | In the race 54.2% | 12/16 | 10/18 |
| Chris Klingenberg | In the race 36.4% | 12/16 | 10/18 |
| Eric Mannila | Needs a run 8.8% | 3/20 | 10/18 |
| Ryan Bousquet | Life support 5.3% | 3/17 | 3/16 |
| Matt Gerardi | Life support <0.01% | 3/17 | 0/8 |
| Brian Cross | Life support <0.01% | 1/17 | 0/8 |
| Josh Martel | Life support <0.01% | 1/17 | 0/8 |
“Made it”: teams in the same position after Week 10 of a past season who went on to make the playoffs, out of all such teams. All-Play rank is grouped in pairs (tied teams share the higher rank); win totals are grouped in five bands, among seasons with the same number of games so far. Categories come from this week’s playoff odds: Contender 90% or better, In the field 60–90, In the race 25–60, Needs a run 8–25, Life support under 8.